

Shoppers are turning to smarter risk screens , Fuse has rolled out Watch globally, giving brokers, carriers and ILS managers a single, live workspace that fuses satellite, seismic and meteorological feeds so teams can see who’s at risk and why, exactly when it matters.
Essential Takeaways
- – Global coverage: Watch now spans five macro regions and 22 sub-regions, plus a global satellite layer for total portfolio visibility.
- – Live integrations: Ten authoritative feeds power the platform, including USGS, NASA FIRMS, the Japan Meteorological Agency and other national agencies.
- – Real-time portfolio impact: Sync your book of business so Watch computes TIV at risk and names affected insureds and carriers as events unfold.
- – Ten peril classes tracked: Earthquake, cyclone, flood, wildfire, volcano, drought, severe convective storm, winter storm, heatwave and coastal/marine hazards are monitored continuously.
- – Practical alerts and exports: Geocoded locations feed a severity-ranked Portfolio Alerts inbox, with one-click drill-downs and exportable exposure snapshots for reporting and renewals.
Why real-time peril intelligence feels like common sense now
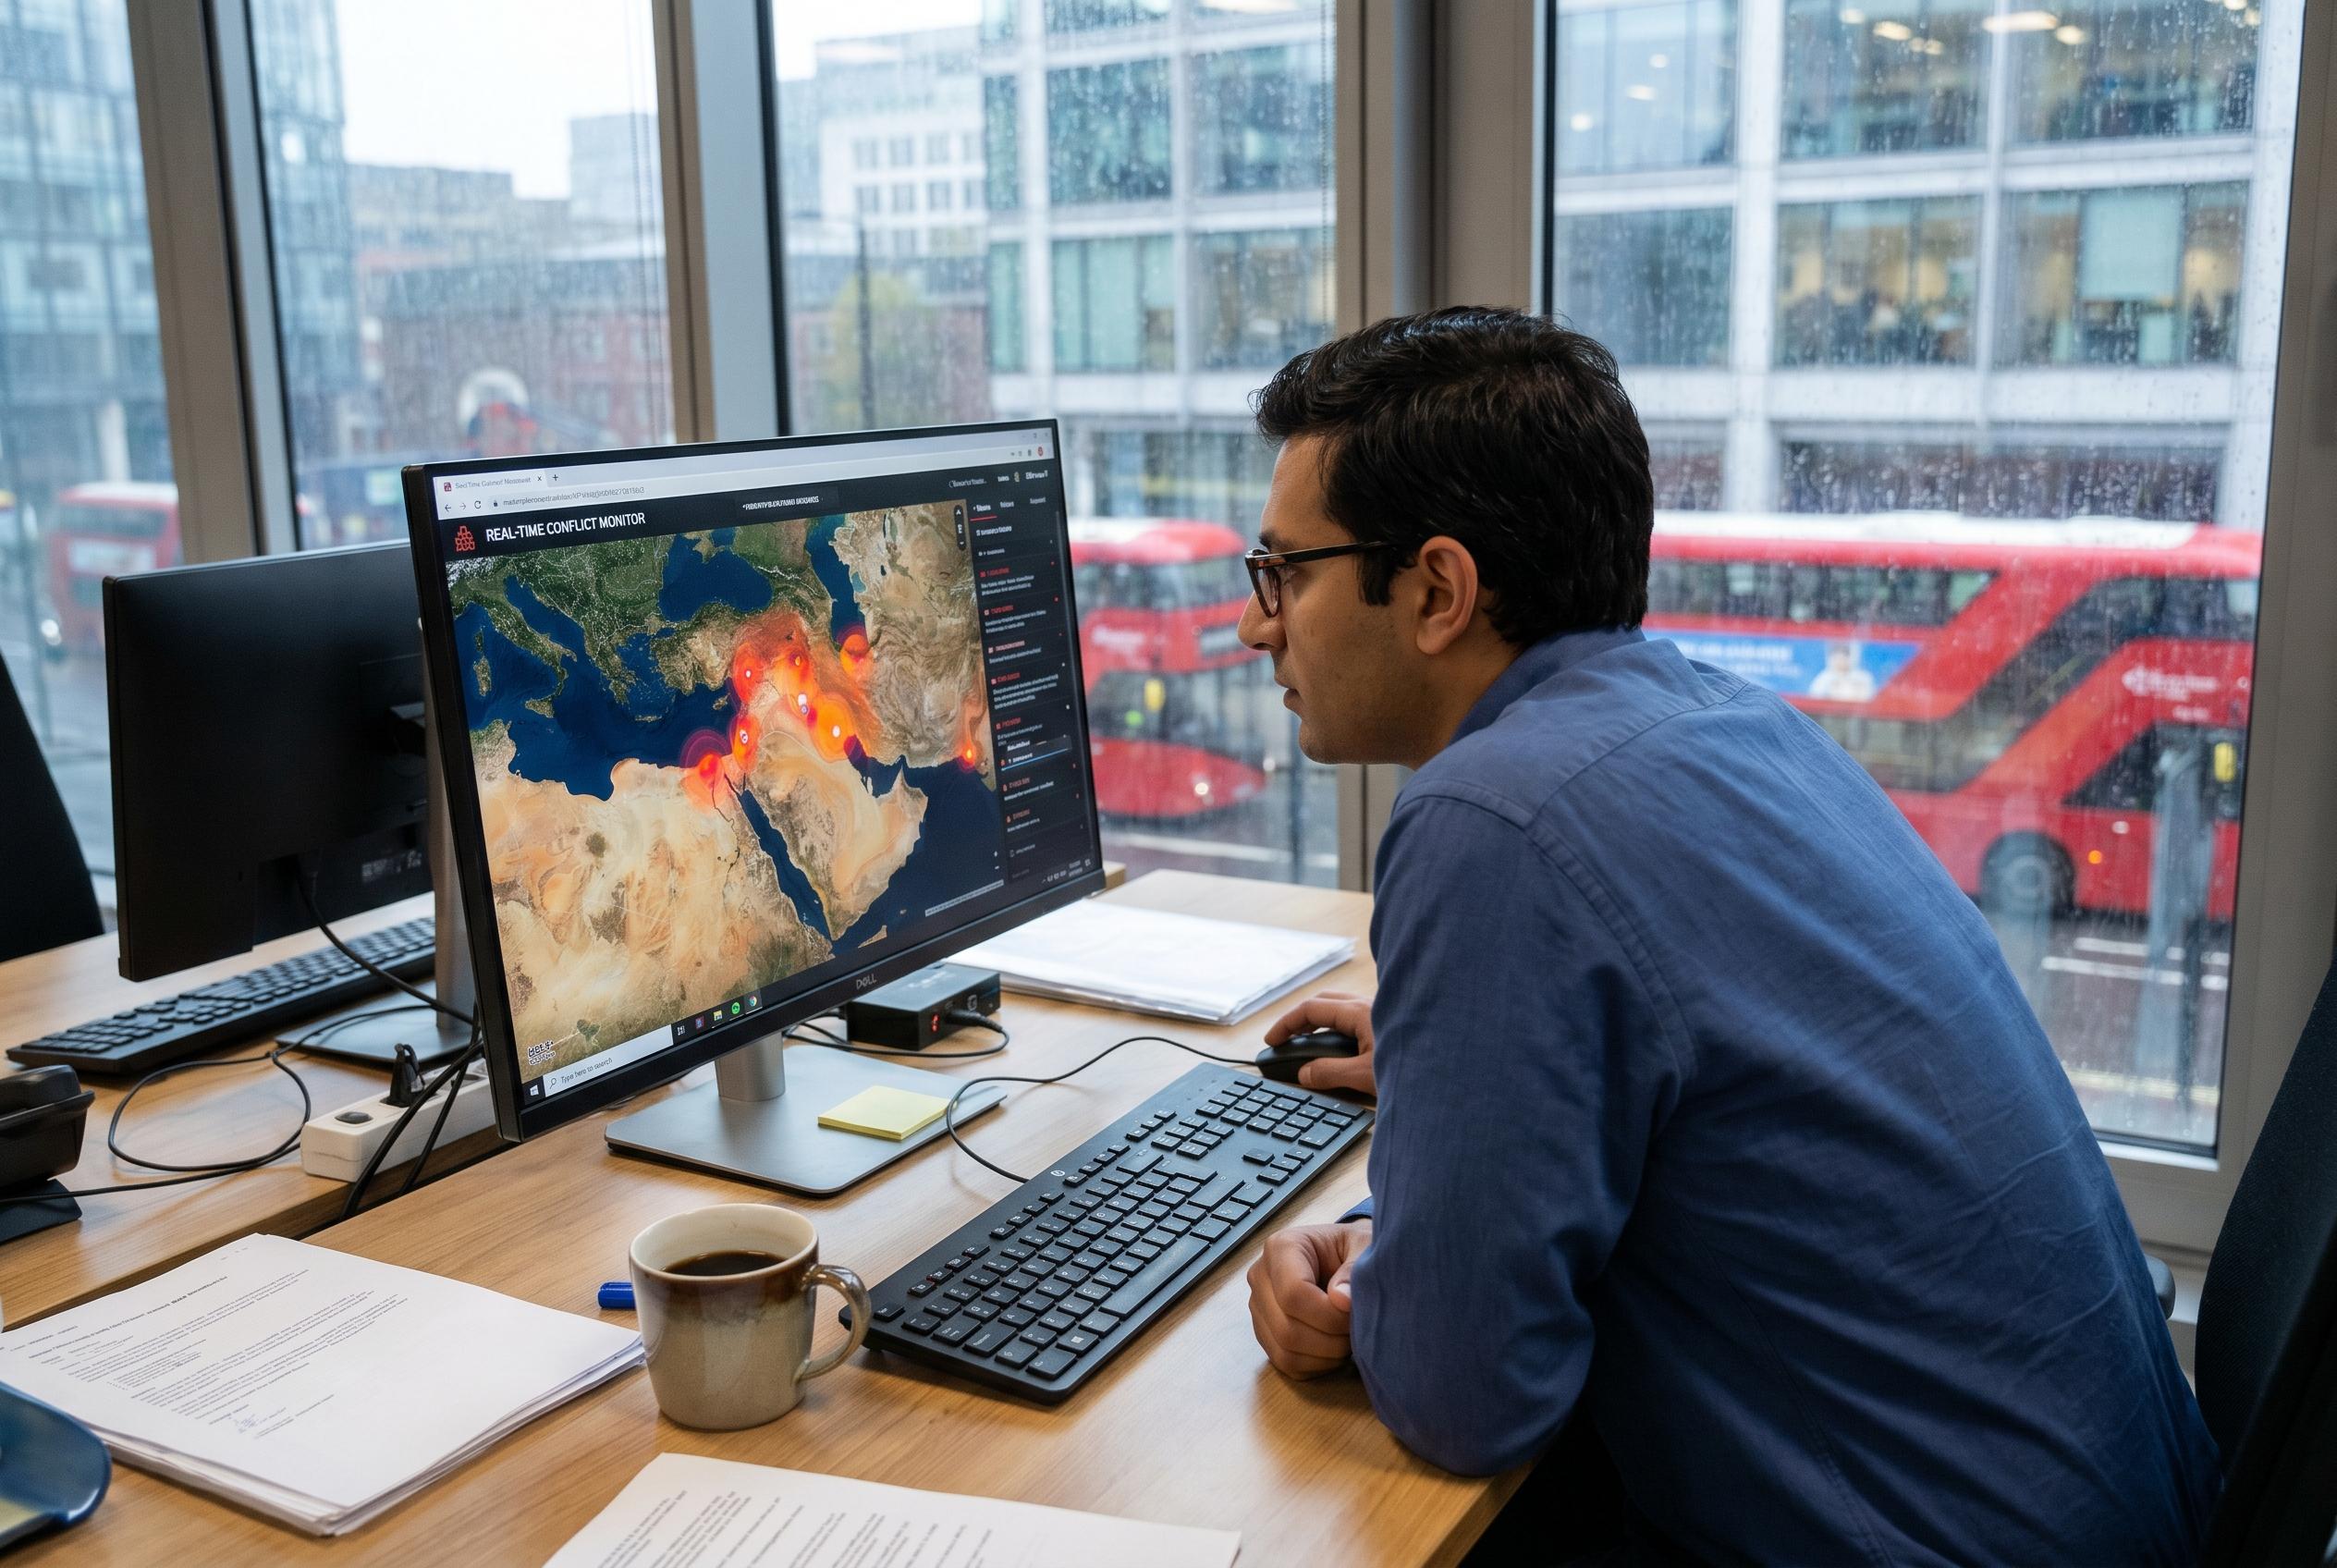
If you’ve ever heard about a storm on the news and realised a key client sits directly in its path, you’re not alone , the insurance market has been coping with fragmented feeds and manual triage for years. Fuse’s Watch aims to change that by putting a live, visual layer over your actual portfolio. The first thing you notice is how immediate it feels: satellite pixels, seismic shakes and weather warnings converge into a single map, and that’s reassuring in a practical, sensory way , you can see the red zones before the phone starts ringing. According to industry reporting, the platform’s global rollout builds on its U.S. debut earlier this year and was designed to close longstanding transparency gaps.
How Watch stitches authoritative data into one view
Rather than asking teams to stitch together multiple regional sources, Watch ingests ten premier feeds , think USGS for quakes, NASA FIRMS for thermal hotspots and national meteorological agencies for storms. That mix gives brokers and underwriters confidence that the platform isn’t guessing: it’s reading the same official inputs they’d otherwise monitor separately. The payoff is speed and clarity: events are spatially intersected with geocoded accounts in sub-minute windows, so you see which clients fall inside an impact polygon and which carriers sit on the affected layers almost immediately.
Why syncing your book of business matters
Raw hazard maps are useful, but the real value arrives when you overlay your own exposures. Watch computes total insured value at risk for each event and flags the affected insureds and carriers. For claims teams and catastrophe modellers this removes a layer of guesswork , instead of poring over spreadsheets you get triaged alerts ranked by severity. That’s also why ILS specialists have taken notice: the platform makes it far simpler to assess accumulation across bonds and placements on a global basis, helping investors and structurers understand immediate implications without waiting for quarterly cessions.
Practical features that make daily work easier
Beyond the map, Watch offers a rules engine for user-defined thresholds, a standing exposure heatmap by peril and geography, and exportable exposure snapshots for carrier and cedent reporting. Those are the sorts of neat, practical touches that change workflows: you can set a trigger for any crossing of a TIV threshold, get a severity-ranked inbox of affected accounts, and export a report to feed renewal conversations or regulatory filings. In short, it’s designed to shift teams from reactive firefighting to proactive risk management.
What this means for different parts of the market
Brokers will like the immediacy when top clients are threatened; carriers get clearer accumulation views and faster triage for claims surges; reinsurers gain near-real-time visibility into cessions; and ILS players get cleaner situational awareness for portfolios spanning regions. Industry voices argue that opacity has been an accepted cost of doing business , Fuse’s CEO summed it up by saying the market shouldn’t wait on calls or spreadsheets to learn what’s happened. Whether you’re risk engineering, underwriting or handling renewals, the practical effect is the same: quicker, evidence-backed decisions.
It’s a small change that can make every catastrophe response a lot steadier.
Source Reference Map
Story idea inspired by: [1]
Sources by paragraph:
– Paragraph 1: [2], [3]
– Paragraph 2: [2], [5]
– Paragraph 3: [2], [3]
– Paragraph 4: [4], [5]
– Paragraph 5: [2], [3]


